The petroleum industry has existed for over 150 years, but until very recently didn't have universally accepted definitions for all of the terminology associated with oil resources and production. There is a somewhat lengthy history involved in the establishment of rules and terms associated with assessment, measurement, and reporting of resources.
Terms that the news media, government officials, and oil industry PR agents throw around have definitions which historically have been unclear, changing, and oftentimes misrepresented. For this reason, I'd like to direct you to a .pdf document on the Society of Petroleum Engineers website www.spe.org :
Sponsored by:
Society of Petroleum Engineers (SPE)
American Association of Petroleum Geologists (AAPG)
World Petroleum Council (WPC)
Society of Petroleum Evaluation Engineers (SPEE)
Society of Exploration Geophysicists (SEG)
This is not only a helpful document in terms of understanding terms and definitions (there is a glossary of "Reference Terms" at the end), but it also includes a short history of petroleum terminology, outlines procedures for classifying different resources, and provides insight into the methods used in assessing petroleum resources, along with a peek into cost and recovery factors.
The terminology used by the oil industry seems deliberately misleading and confusing. One prime example is the confusion between the terms "shale oil" and "oil shale." Here are these and a few other definitions to get you started:
Shale Oil most often refers to "tight oil" (what is usually light or medium viscosity conventional oil) trapped in pockets within shale formations. The Bakken Formation in North Dakota, is one such formation. The process used to extract this resource is called hydraulic fracturing (or more commonly: fracking), and involves injecting a mixture of water and chemicals at very high pressures into the shale to pulverize the stone and make the liquid petroleum accessible for pumping out of the ground. This technology is not new- it only recently became profitable due to high oil prices- although oil companies have made modifications to the technique in the past few decades.
While oil prices remain high, the industry will continue to use fracking to gain access to the large quantities of technically recoverable shale gas and shale oil trapped within such formations in the lower 48 states of the US.
Oil Shale refers a waxy, solid hydrocarbon substance called kerogen found within some sedimentary rock formations, or it may refer to a number of other bituminous compounds found in rock. This resource is not oil; it requires either extreme heating or chemical processing in order to transform it into synthetic oil, and cannot directly be pumped out of the ground because of its solid state. The industry has been experimenting with various other processes, including heating the underground formations to 500 degrees Celsius, or transmitting very high energy radio waves into the formations. Without somehow changing the state of the kerogen, the resource must be mined. In any case, extensive processing and refining is necessary to create a commercial product. The oil industry does not currently have many commercial-scale kerogen extracting sites and estimates on the development of new ones are usually quoted in decades, even when laying out optimistic assessments.
Reserves/Proven Reserves are not how much oil a country possesses in a warehouse somewhere or even underneath the ground, but rather reserves are an estimate of how much oil can be extracted with today's technology at a cost that is profitable at today's prices. There are usually three figures in calculating reserves- a low (1P- also taken to be "Proved/Proven Reserves"), medium (2P = Proved + Probable Reserves) and high (3P = Proved + Probably + Possible Reserves) estimate. We can generally assume that the figures being reported in official reports by the US Geological Survey, the EIA, The Oil & Gas Journal, OPEC and British Petroleum are the 1P Reserve values if they cite "Proved Reserves." News reporters, bloggers, politicians, pundits and sometimes even oil industry executives like to quote whatever figure is convenient to make their point, and rarely cite their sources or disclose which figure they are using.
Reserve Growth is a situation in which over a given year or time period, despite oil production and sales, a country's/region's Proven Reserves grow instead of shrinking. This happens for many reasons:
New oil fields are discovered
New/improved methods/equipment/technology allow greater recovery factor of oil resources
The price of oil went up, allowing previously unprofitable deposits to become economically recoverable
Recovery Factor/Recovery Efficiency is a numerical expression (usually a percentage) of the amount of oil in a known deposit that can be ultimately recovered using existing processes of extraction.
Petroleum Resources is a slippery term. One way to look at this is that it denotes the amount of resources estimated to be in the ground- whether it is deemed recoverable or not- and often this figure includes any amount which has already been extracted. When that is the case, it should be referred to as "Total Petroleum Resources Originally in-Place" or "Original Resources In-Place" or some other permutation of similar terms.
Example: A hypothetical oil field, discovered in 1934, has "Total Petroleum Resources Originally In-Place" of 132 million barrels, a technically recoverable amount of 32 million barrels (due to geological limitations), and has been in continuous operation for 80 years. In that time, 7 million barrels of oil have been produced. In 2014, due to economic factors, the field has Proven Reserves (1P) of 5 million barrels, 2P estimate of 8 million barrels, and 3P estimate of 11 million barrels-- but the figure for "Original Petroleum In-Place" will continue to be counted as 132 million barrels, forever.
Sometimes, without notice or explicit explanation, quantities referred to as "Petroleum Resources" will reference "Total Petroleum Resources Originally In-Place."
This is a <<"Mommy, What are Sparks Made Of?">> Comment on the U.S. Department of State (DOS) Notice: Presidential Permit Applications: TransCanada Keystone Pipeline, L.P, National Interest Determination NO KEYSTONE XL PIPELINE The United States must divest from petroleum. The benefits of that fuel over the last century have been enormous-- because cheap oil has effectively been like steroids to the economy of the 20th century, but cheap oil is a thing of the past. Our economy is addicted to oil and we desperately need to break the habit, or risk continuous global economic instability. Committing to the Keystone XL Pipeline is the wrong move-- economically and environmentally. The SAGD bitumen removal system provides a low EROI, which makes the tar sands a poor energy choice. Over 30 oil companies have been working on this project for decades and the best extraction method they've come up with yields perhaps a 4:1 energy gain *prior to* cracking, shipping, and refining; while using a substantial amount of natural gas (to extract the projected amount of 173 billion bbl of proved reserves requires approximately 7.2 trillion cubic meters/254 trillion cubic feet of natural gas-- 4.3 times Canada's current natural gas reserves). The overall benefits of the project will be barely noticeable. Even when the tar sands region reaches target production, we will barely know that it's even happening. We will neither experience a substantial gain in supply over the long run, nor a reduction in price; in fact, the Tar Sands project depends upon high oil prices to continue. Transport by pipeline to Gulf Coast refineries will look very good on the books-- but in real life, the gains are slim and the potential costs are immense. TransCanada promises an absurd amount of job creation, but looking over the actual staff of existing pipelines shows that few actual permanent jobs will be involved in maintaining this new one. Proponents say that Keystone XL will be safer than "oil trains" -- but it would be foolish to assume that the pipeline would end transport by train (and if it does, did the pipeline just net negative job creation?). A temporary reduction in shipping by train may occur, but eventually the bitumen will be shipped by *both* train and pipeline. The chances of spills/accidents will have increased, not decreased. From the pipeline to the tailpipe, this "oil" resource is dirty and environmentally disastrous. The cost/benefit analysis of this project has netted positive results only in the "best case scenario" and even then, the advantages are rather insignificant and temporary. It is not worthwhile to approve this pipeline. The United States needs to put more effort into reducing its dependence on oil and other fossil fuels. The best way to meet that end is to make fewer future commitments to oil, and concentrate more on research & reduction in the present. The US could be a leader in alternative energy research and production, and could serve as an example to the rest of the world -- the developing world especially -- to divest from fossil fuels and build a more sustainable and resilient world economically and environmentally, but we cannot do this by expanding our current dependence. Say "NO" to TransCanada's Keystone XL project.
Solar energy has made considerable gains in efficiency in the last decade and better yet, the price of photovoltaic (PV) panels has dropped significantly.
However, one feature of PV panels is that they are virtually unresponsive to the infrared part of the light spectrum. About 40% of the sun's energy reaching Earth is in the infrared range. By developing PV panels that can transform even a fraction of infrared light into electrical current, we could create a vast increase in PV efficiency and power output.
How about night-time? Everyone knows that PV cells don't produce electrical current in the dark. So right off the bat, we're losing at least 50% efficiency on every PV panel no matter how good it is, because more than half the time it doesn't work.
Here are two interesting pieces of research that together could forever alter the utility of solar PV panels.
The first link - an article in Popular Science online magazine - is about a new phosphorescent liquid developed by researchers at the University of Georgia that charges up in about one minute and emits light in the infrared range for up to two weeks.
To quote popsci.com:
"They tested it in natural sunlight, color-filtered sunlight and fluorescent light, and found it works with just a few seconds of light exposure, even on a cloudy day. It works in liquid, too, including tap water, saltwater and bleach, which could make it very useful for deep-sea applications or even in living organisms. The material could also be useful in developing more efficient solar cells, nanoparticles that bind to cancer cells, or in infrared paint only viewable by people with IR goggles, the researchers say."
This is great because you could actually put this liquid within a plastic film that could be rolled out automatically over PV arrays to charge for just a few minutes a day, roll back up, and then roll out over the PV panels overnight.
"But I thought you said that PV panels ignore infrared?"
--Yes. However, a new material composed of a specific type of carbon nanotubes and C60 (AKA Buckyballs) actually does the job. According to the article on MIT's website:
"The carbon-based cell is most effective at capturing sunlight in the near-infrared region. Because the material is transparent to visible light, such cells could be overlaid on conventional solar cells, creating a tandem device that could harness most of the energy of sunlight."
However, it's still in the research and development phase.
"The carbon cells will need refining, Strano and his colleagues say: So far, the early proof-of-concept devices have an energy-conversion efficiency of only about 0.1 percent."
While 0.1% sounds rather minuscule, it's important to point out that new solar technology generally begins at low efficiencies and gradually get better through the development process. And also, 0.1% efficiency is actually a lot better than what photovoltaics are currently getting out of infrared light, which is nothing.
Once the kinks are worked out, PV panels could be constructed with an infrared-gathering carbon nanotube layer working all day, and working all night because you unrolled your infrared-glowing phosphorescent sheet on top of it.
"Well, in our country," said Alice, still panting a little, "you'd generally get to somewhere else — if you run very fast for a long time, as we've been doing."
"A slow sort of country!" said the Queen. "Now, here, you see, it takes all the running you can do, to keep in the same place. If you want to get somewhere else, you must run at least twice as fast as that!"
- "Through the Looking Glass" by Lewis Carroll
The Myth of "Energy Independence" in the United States: Running with the Red Queen
The energy situation in the United States is currently a lot like this scene from "Through the Looking Glass," in which Alice and the Red Queen are running faster and faster but still don't seem to get anywhere.
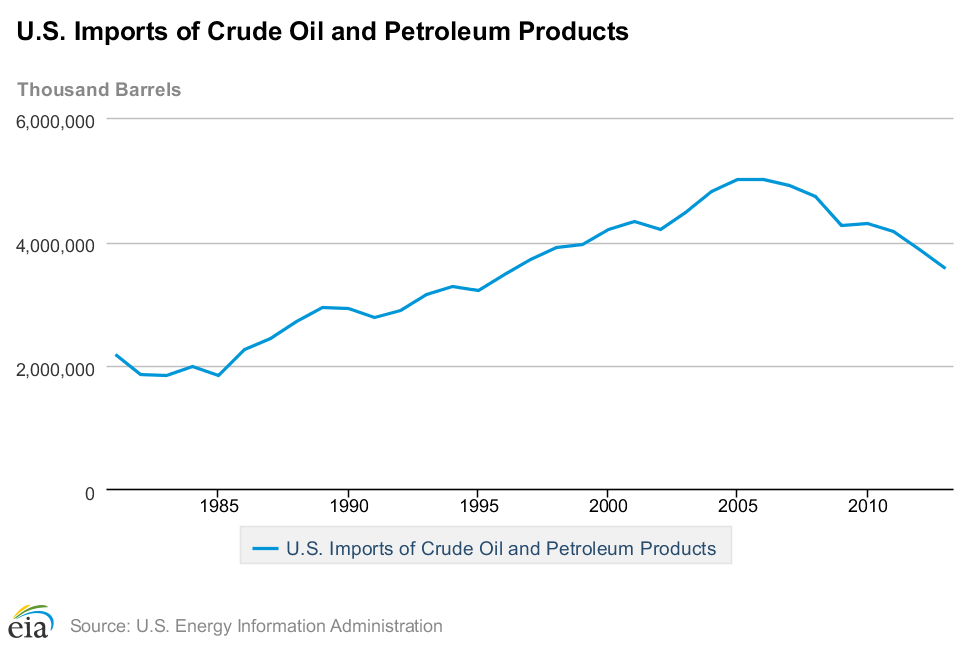
The fact that the US's net imports of crude oil & petroleum products has shrunk in the past few years is touted as evidence that the US can achieve "Energy Independence." However, it is mainly a misrepresentation of facts, or a misunderstanding of the data.
At the surface, it looks very good. The US is now producing more oil than it has since 1989, and net imports have fallen to about 6.2 million barrels per day -- lower than net imports of 1991 and 1988 (the historical high was 2005's net imports of 12.5 million barrels/day).
Note: This graph depicts data in Barrels per DAY
However, total imports have not followed exactly the same curve, and are substantially larger than net imports.
Note: This graph depicts data in Barrels per YEAR.
There are several reasons for this. The biggest factors are:
Total imports minus exports equals net imports; the United States is one of the largest petroleum product exporters in the world, despite the fact that it routinely consumes more product than it produces.
Total imports have fallen in general, while exports have increased dramatically.
US consumption of crude oil and petroleum products is presently at its lowest point since 1997/1998. Per capita oil consumption is at its lowest point in over 50 years.
Domestic oil stocks; an on-hand supply of oil and petroleum products that have already been produced and/or refined, but not yet sold/consumed.
Refining gains; simply put, is the reality that the refining process creates gains in volume from barrels of crude oil to barrels of refined product.
US oil companies sometimes import crude, refine it, and then export it or sell it domestically as a domestic product.
Note: This graph depicts data in Barrels per DAY.
US oil exploration & production has been swiftly ramped up in part due to President Obama's "All of the Above" energy strategy, and relentless political pressure by the oil & gas industry. "New" oil discoveries and "new" technologies have made it possible to slingshot the US into accelerated production.
(The word "new" is in quotation marks because the only thing that's truly new about these oil resources and extraction methods is that the political advantages and price of oil are finally high enough to warrant these types of operations).
US oil production is currently higher than it has been at any time since 1989. That's not bad. To some, it looks like the United States is finally on the road to self sufficiency.
Note: This graph depicts data in Barrels per DAY
.
The US has never produced more than 10 million barrels per day, while consumption has remained close to 19 million barrels per day for decades.
Note: This graph depicts data in Barrels per DAY.
Comparing US oil consumption to oil production data also reveals that one reason total imports & net imports have fallen is partly due to rising efficiency. However, consumption has also fallen because of high oil prices:
The above graph shows US oil production & consumption, represented by yellow & green bars, respectively. The blue line represents US oil consumption per capita. Data depicted in Barrels per DAY.
The gains in efficiency/conservation of oil consumption have been exemplary over the last 35 years. However, the main motive for increasing efficiency/conservation seems to be high oil prices. When the prices fall, consumption appears to rise slightly or stay stable. This next graph shows oil consumption per capita over the price per barrel (inflation adjusted):
All that is fairly obvious and basic economics. The bottom line looks very good on a dollar-for-dollar basis. While oil prices are fairly high, oil companies can continue to use these "new" techniques to open up these "vast" US oil resources that were previously unprofitable to extract. That opens the door to further innovations that may bring down the price of oil, right? Won't the US be able to produce more and more oil until it has no reason to import, thereby achieving "Energy Independence?"
...Probably not. As implied earlier, the fact is that even at peak production in 1970, the US was still only producing about half as much oil as the country currently consumes each day.
The thing is that the oil that US companies are drilling for right now is simply not as easy to get as it was in the 1970's. Once the US hit its peak, it took more and more oil rigs to locate discoveries & produce even fewer barrels of oil than the year before:
There are many other kinds of oil rigs in use in the US, but rotary rigs account for more than 80% of oil production.
The reason for this is decline rates- when wells are tapped, they produce huge volumes of oil for the first few years, then taper off to a fraction of their original production volume. When the decline rates fall past a certain "economic" limit, oil companies sell them to smaller companies or simply seal them off.
While prices remain high, politicians remain under intense pressure to open up private and public lands to new oil & gas operations. In order to achieve the same oil production that the US had in 1989, oil companies have three times as many oil rigs in operation searching for more profitable plays.
How much of its own oil would the US have to produce to be considered "Energy Independent?" Eighty percent? Ninety percent? One Hundred percent?
Given that the US has over 1,400 crude oil rotary rigs in operation today, and produces only about 48% of the oil it consumes, how many rigs would it need to achieve 100%? How many new plays must be discovered & how many new wells have to be tapped each year to sustain that rate?
That's why the situation is very much like that scene in "Through the Looking Glass." The US will have to run faster and faster each year just to stay in the same place.
UPDATE:
For reasons that are complex enough to deserve probably an entire mini-series of blog posts, the price of oil dropped substantially in recent months. The main result of this will be scaling back on exploration & discovery, fewer new off-shore and hydraulic fracturing projects across the board, and possibly closing down some of the less profitable operations by both small and large oil & gas companies. A bit down the road (depending on how long this all lasts) we may see some mergers & acquisitions among oil companies-- but we'll definitely be seeing some of the smaller/newer operations closing down or filing bankruptcy.
Few of us can accurately guess how long this oil price collapse will last, but it's likely to shape the way the world will produce oil for the next few years (at least) and will likely secure Saudi Arabia as the #1 oil exporter in the world-- putting the US back down to #2.
This type of market instability is disruptive to the economy as a whole and (in my personal opinion) is further evidence of the need to develop & deploy more alternative energy solutions!
Check out factcheck.org's article on the Keystone XL pipeline, "Pipeline Primer." If you don't feel like reading much, you can watch their video instead:
Factcheck.org's Copyright Policy requests full credit to the author and to factcheck.org, that a link to factcheck.org be prominently posted on the website, and that when the article is redistributed that the entire article is posted. But I really really really want you to go to factcheck.org for yourself instead of just reading their article here. They do great work, and have thousands of articles on many many topics.
Here is the article in full, written by Brooks Jackson. I hope you don't find it lazy of me to redistribute this, but as I said, the Copyright Policy insists this is preferable to potentially taking anything out of the original context of the article.
After the full text of the article and sources, I have some comments:
Pipeline Primer
The Keystone XL project: We examine the facts about jobs, spills, climate change and gasoline prices.
Posted on March 10, 2014
Summary
After more than five years of claims and counter-claims about the proposed Keystone XL pipeline, President Obama is expected to make his final decision soon. So we thought it was a good time to sift through the disinformation and lay out some basic facts.
Building the pipeline will create jobs in the U.S., but not as many as supporters have claimed, and only for a year or two. The U.S. State Department estimates that 42,100 jobs would be added during construction, but that only 50 workers would be required to operate the pipeline.
Oil from Canadian bitumen deposits — which the Keystone would carry from Alberta to the U.S. for refining — results in 14 percent to 20 percent more greenhouse gas emissions than oil typically consumed in the U.S. at present.
But that doesn’t mean that stopping the pipeline would prevent Canadians from extracting their crude and getting it to market to be burned, either in the U.S. or other countries. “Such a change is not likely to occur,” State concluded.
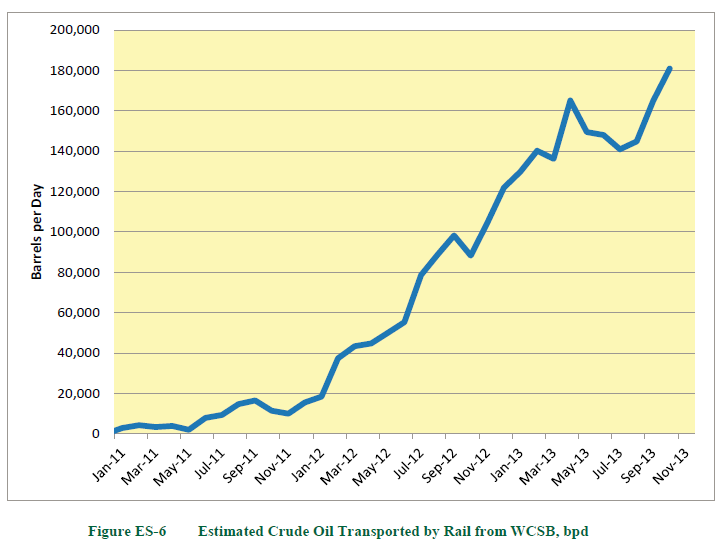
In fact, much of that oil is reaching the U.S. already — by rail — and more tank-car capacity is being added quickly. Canadians also are proposing two other pipelines to tanker ports on the Pacific coast, and a third project to nearly double the effective capacity of an existing line to the U.S.
Pipelines are dangerous, but tanker cars are more so. Rail accidents spilled more oil in the U.S. last year than in all the previous years on record combined. And in Canada, 47 people died in one fiery tanker-train disaster in Quebec last year.
Analysis
The pipeline would be built by TransCanada Corp. and would run 1,179 miles from Hardisty, Alberta, to Steele City, Neb., where it would connect with existing pipelines to refineries on the Gulf Coast. The U.S. segment would be 875 miles long, running through Montana, South Dakota and Nebraska. The 36-inch diameter line could carry up to 830,000 barrels (nearly 35 million gallons) of oil per day.
Because it would cross the U.S.-Canadian border, it would require a finding by the Obama administration that building it is in the national interest. The State Department, after lengthy review, submitted its Final Supplemental Environmental Impact Statement on Jan. 31, and said it would receive public comments until March 7. No date has been announced for a final decision.
The debate over the project has pitted environmentalists — who hope to block the project on grounds that it would worsen global warming and result in hazardous oil spills — against the president’s critics on the right — who say he should have approved it long ago to create jobs and lessen U.S. dependence on oil from less friendly countries.
Jobs
Any big construction project requires workers to build it. How many? The U.S. State Department’s analysis says 3,900 would be employed directly if the job is done in one year, or 1,950 per year if work is spread over two. TransCanada Corp. puts the number higher, saying the project would support 9,000 construction jobs directly.
There would be additional, “indirect” work for companies supplying goods and services, including concrete, fuel, surveying, welding materials and earth-moving equipment required for the project, and “induced” jobs resulting from money spent by workers and suppliers, such as ranchers providing beef for restaurants and construction camps. Counting up everything, the State Department estimates a total of 42,100 jobs could be created.TransCanada has accepted the 42,100 figure for total employment.
Whatever the number, these jobs are temporary, lasting only for the year or two that it would take to complete the project. The number of permanent jobs is much lower. “The proposed Project would generate approximately 50 jobs during operations,” according to State’s analysis.
House Republicans are still claiming the project would create 120,000 jobs. But that’s based on outdated information. The House Energy Committee’s GOP majority website extrapolates from figures given by TransCanada two years ago — for a much longer pipeline than is now proposed.
That was before President Obama initially rejected the original Canada-to-Texas project pending changes in the route. Since then, TransCanada has completed a 485-mile segment of the original project — running from Cushing, Okla., to refineries in Texas — which did not require presidential approval because it did not cross an international border. Now named the “Gulf Coast Pipeline Project,” construction began in August 2012 and was completed this year. It went into operation on Jan. 22.
The current Keystone XL project includes 875 miles within the U.S. And, as noted, even TransCanada says it would create about 42,000 temporary jobs, not 120,000.
Environment
Critics of the pipeline are fond of saying it would carry “the dirtiest oil on the planet,” and there is no question that the oil is significantly “dirtier” than most in the sense that it results in more greenhouse gas emissions.
It comes from Alberta and parts of Saskatchewan, in what the industry calls “oil sands” and environmentalist critics call “tar sands.” By either name, they are vast deposits of bitumen — a form of petroleum so dense that at a temperature of 52 degrees Fahrenheit it is “hard as a hockey puck,” according to the Canadian Association of Petroleum Producers. It must be heated or diluted to be made to flow through pipes.
The bitumen is found mixed with sand and clay. Extracting it requires a good deal of energy — either through open-pit mining from surface deposits or by injecting steam into deeper, “in situ” (in place) sites. Refining it into useful fuels also requires more energy — and hence more emissions — than lighter forms of petroleum.
How much “dirtier” is it? The nonpartisan Congressional Research Service surveyed published scientific literature on the subject, and those studies found variously that getting Canadian bitumen produced and processed into fuel produces between 70 percent and 110 percent more greenhouse gas emissions than the weighted average of transportation fuels now used in the U.S. That’s what’s called a “well-to-tank” figure, the measure preferred by critics.
However, once it is in the tank, gasoline or diesel fuel that comes from Canadian bitumen is no different than fuel from any other form of petroleum. And burning the fuel in car and truck engines produces a lot more emissions than producing it and getting it to the pump.
So over the entire “life cycle” of a fuel — from in the ground to out the tailpipe — burning a gallon of fuel from the Canadian oil results in 14 percent to 20 percent more greenhouse gas emissions, on average, than burning a gallon of currently available fuel, according to the CRS study. That’s called a “well to wheel” figure. The State Department’s final environmental report put the well-to-wheel figure at 17 percent — squarely in the middle of the published studies surveyed by CRS.
CRS estimated that oil flowing through the Keystone pipeline would result in an increase in U.S. emissions of greenhouse gases equivalent to adding somewhere between 770,800 and 4.3 million passenger vehicles. But whether that would mean any increase at all in globalemissions “remains uncertain,” CRS said. And the State Department said “such a change is not likely to occur.”
Last year the Environmental Protection Agency officially questioned a similar conclusion contained in an earlier draft of the report, and said State should “provide a more careful review of the market analysis” that supported it. State did so, conducting economic modeling of 16 different sets of supply-demand assumptions and pipeline constraints, which it said showed that “cross-border pipeline constraints have a limited impact on crude flows and prices.”
And meanwhile, more and more Canadian oil is already coming to the U.S. in tanker cars, just as State predicted.
Alternatives
Railroad Tank Cars: A substantial amount of Canadian oil is already entering the U.S. by rail, in tank cars, and the amount carried this way is rising sharply. No White House approval is required.
Rail shipments have skyrocketed since the time the White House rejected the original Keystone route, when the shipments were less than 20,000 barrels per day. The State Department’s final environmental report estimated that 180,000 barrels per day were already being transported by rail from the Western Canadian Sedimentary Basin, amounting to nearly 22 percent of the volume that the Keystone could carry (830,000 barrels per day). And the industry is adding new rail capacity rapidly.
For example, on Dec. 20, plans for a new loading facility in Edmonton (Alberta’s capital) were announced. It is projected to be in operation by the end of 2014, with an eventual capacity to load 250,000 barrels per day for shipment to North American refineries. Another new rail terminal is planned for Hardisty (where the Keystone pipeline would originate) with a capacity of 140,000 barrels per day, to begin operations early this year. The international information company IHS estimates that as much as 450,000 barrels per day could be moving by rail by the end of 2014, according to CNBC.
Other Pipelines: Besides the Keystone, three other pipeline projects are being proposed to carry Alberta crude oil to market. Two would carry it across the mountains of British Columbia to ports on Canada’s Pacific coast, to be loaded on tankers and shipped mostly to China and other Asian markets (and with some going to California), while a third would nearly double the effective capacity of an existing line to the U.S.
Opinion in British Columbia is narrowly divided. A Jan. 22 poll by the Canadian polling company Insights West found that 48 percent said they favored the project, while 43 percent said they opposed it. The poll also showed that support has grown since another poll the previous year, when the pipeline proposal was in a preliminary phase. Insights West said that between the two polls, those favoring the project jumped by 10 percentage points, while those opposing it dropped by 14 points.
That could change, of course. A later poll commissioned by environmental groups found that 64 percent of British Columbia residents opposed “allowing crude oil supertankers through B.C.’s northern inside coastal waters” to load oil carried by the proposed pipeline. But the same poll found that 64 percent also said they “believe Enbridge will succeed in building its pipelines and tanker proposal,” while only 12 percent thought it would fail.
Pipelines can be hazardous. An average of 97,376 barrels (4.1 million gallons) of petroleum and other “hazardous liquids” have been spilled each year in pipeline incidents over the last decade, according to the Department of Transportation’s Pipeline & Hazardous Materials Safety Administration. These incidents have claimed an average of two lives per year, and resulted in more than $263 million in annual reported property damage as well.
Those figures include the most expensive onshore oil pipeline spill in U.S. history, caused when 30-inch pipe operated by Enbridge ruptured on July 26, 2010, near Marshall, Mich. That dumped more than 1 million gallons of Canadian diluted bitumen — the same material that would be carried in the proposed 36-inch Keystone pipeline — into the Kalamazoo River. Enbridge is still struggling to complete the cleanup, having failed to meet a Dec. 31 Environmental Protection Agency deadline for dredging remaining oil residue that settled on the bottom of the river. Although Enbridge initially put the spill at about 840,000 gallons,the EPA said last year that 1.15 million gallons had been recovered and 350,000 cubic yards of contaminated river sediment remained to be recovered. Enbridge said in August 2013 that it had spent more than $1 billion on the cleanup and remediation to date, and the figure continues to rise.
A spill from the Keystone could potentially have similar effects. The Nebraska Department of Environmental Quality, in its final evaluation report on the project, found that the properties of the diluted forms of bitumen that would flow through the state in the Keystone pipeline “are similar in many respects to other heavy sour crude oils.” For what it’s worth, TransCanada says it plans to make the Keystone “the safest pipeline ever constructed in the U.S.,” adding more remote shut-off valves and inspections and burying the pipe more deeply than with other pipelines.
Quebec Oil Train Disaster
Rail transport is even more hazardous than pipelines, however. Last July, 47 people died in a single disaster when an unattended train including 72 tanker cars loaded with crude oil rolled downhill, exploded and burned in the Canadian town of Lac-Mégantic in Quebec province. Forty buildings were demolished, and an estimated 5.6 million liters (1.5 million gallons) of crude oil spilled or burned.
And that calamity is by no means an isolated incident.
The tempo of oil-train accidents has increased along with the sharp rise in tanker shipments, as has the amount of oil discharged. Soon after the Casselton spill, an investigative news report by the McClatchy news agency concluded, based on federal data, that last year more oil spilled in the U.S. from rail tank cars than in all the nearly 40 previous years on record combined.
The incidents continue. On Feb. 13, several cars of a train carrying heavy Canadian crude derailed in Western Pennsylvania. This time only a few thousand gallons leaked out, and there was no fire or explosion.
But later that month, on Feb. 26, a representative of the National Transportation Safety Board, Robert L. Sumwalt, told a congressional hearing that incidents such as the Casselton explosion have become an “increasingly commonplace story.” He said continued use of tanker cars built to meet current federal standards poses “an unacceptable public risk.” Meanwhile, the Association of American Railroads is pressing the federal government to impose “more rigorous standards for tank cars carrying flammable liquids, including asking for retrofitting tank cars to meet the higher standards or phasing those that cannot be made safer.”
Based on relative safety records to date, the State Department estimated that an average of six deaths per year would result if the Keystone isn’t built and the same amount of oil is shipped by rail instead. More than twice as much oil is likely to be spilled as well, State estimated.
The State Department’s analysis concluded that either way, the Keystone project would have “little impact on the prices that U.S. consumers pay for refined products such as gasoline.” That’s because Gulf Coast refineries that process heavy crude could continue to get it from Venezuela or the Middle East, as they do now, if they can’t get it from Canada, the report said. And even if the Keystone isn’t built, Canadian crude still “could reach U.S. and Canadian refineries by rail.”
Other independent experts have said essentially the same thing. Curt Launer, a managing director at Deutsche Bank, has been quoted as saying, “Keystone wouldn’t have a significant impact either way on overall North American energy prices.” Another expert, Morningstar analyst David McColl, was quoted in the same article saying the Keystone would have “no material impact” on gasoline or diesel prices. And even TransCanada doesn’t include lower gasoline prices in its list of the “economic benefits” it claims would result from building the pipeline.
Critics have argued, on the other hand, that Midwestern prices would actually increase, but there’s little support for that idea.
The critics have pointed to an unusual market situation in which crude oil was selling in Oklahoma — as measured by the West Texas Intermediate benchmark price — at far below the world price as measured by the North Sea Brent benchmark. That was due in part to a pipeline bottleneck at Cushing, Okla., that allowed a glut of oil to build up from booming production in the Dakotas and Canada. In 2012, the price for WTI averaged $18 per barrel less than the average world price, according to the most recent report by the U.S. Energy Information Administration. But that “discount” fell below $4 per barrel in July 2013. It rebounded to $14 per barrel in January, and EIA projected that it would average $11 per barrel for all of 2014.
But even when the discount was greater, the lower price of crude oil in the Midwest never translated into consistently lower prices at the pump. A look at EIA’s weekly figures shows that since the start of 2011 the average price of regular gasoline in the Midwest has been only 4 cents a gallon less than the national average, and has ranged anywhere from 20 cents a gallon less to 21 cents a gallon higher. Those who assumed that refiners were passing on their lower costs to consumers were simply wrong.
The State Department analysis came to the same conclusion, finding no correlation between wholesale gasoline prices in the Midwest and the average WTI discount. (See section 1.4.6.1 in the “Market Analysis” section.) In a footnote (number 10), the analysis commented that the cheaper Midwestern crude oil “benefited … refiners,” not motorists.
So, while building the pipeline would undoubtedly provide consumers with some measure of insurance against supply interruptions, as would any additional supply route, there’s simply no evidence that it would have any noticeable effect on prices at the pump, either up or down.
Alleged Conflicts
Foes of the pipeline say the State Department report reflects a pro-industry bias because of an alleged conflict of interest by a firm hired to assist in its preparation. The Sierra Club and Friends of the Earth accused the consultant, Environmental Resources Management, of having ties to the oil industry and hiding a previous connection to TransCanada.
For example, “ERM and TransCanada have worked together at least since 2011 on another pipeline project in Alaska,” Friends of the Earth stated in a July 10, 2013, news release. But ERM said that was wrong. “ERM’s affiliates performed services on the Alaska Project only on behalf of a company other than TransCanada,” the company said in a July 17, 2013, letter to the State Department.
Indeed, the State Department’s Office of Inspector General investigated, and confirmed that work was done for URS Corp., which was hired by Exxon Mobil Corp. The Alaska project was a joint venture between TransCanada and ExxonMobil, but it was ExxonMobil that paid URS, which in turn paid ERM’s affiliates. The inspector general found this didn’t violate any conflict of interest rules, and cleared the department of any wrongdoing in a report released Feb. 26.
Another issue raised by critics is that ERM employees working on the Keystone evaluation had previously worked on projects for TransCanada, and one had formerly been a TransCanada employee. But the inspector general found that didn’t violate any conflict-of-interest rules. The inspector general said the department had substantially followed all regulations for vetting consultants for conflicts of interest, and at times had been even “more rigorous” than required. Overall, the inspector general found that “the Department’s conflict of interest review was effective and that the review’s conclusions were reasonable.”
The Sierra Club and other environmental groups vowed to fight on regardless of the OIG report. On March 3, several hundred people were arrested in student-led protests in Washington, D.C., where some secured themselves to the White House fence with plastic zip ties.
U.S. Department of State; Office of Inspector General. “Compliance Follow-up Review: The Department of State’s Choice of Environmental Resources Management, Inc., To Assist in Preparing the Supplemental Environmental Impact Statement.” 26 Feb 2014.
Commentary from "Mommy, What are Sparks Made Of?":
Great fact-checking, even though they never address the stunning EROI issues inherent in the Canadian Tar Sands project. But I suppose that project will continue whether or not there is a Keystone XL.
After claims that this pipeline would create 120,000 jobs, it's refreshing to get something that at least sounds correct. Around 42,100 jobs during construction (which only will last a year or two) and 50 permanent jobs. The 50 permanent jobs is far fewer than I would have estimated based on the staff of other pipelines - the Trans-Alaska Pipeline System, for example, is operated and maintained by Alyeska Pipeline Service Company, who claims to employ "Almost 811 employees" total, stationed at several locations along the 800-mile pipeline. If we were to assume about 1 employee per mile of the proposed Keystone XL, there would be about 1,700 permanent jobs (about one-third of which would actually be in Canada). Regardless, neither scenario will create a perceptible difference in the overall employment situation in the United States.
Environmental Impact
The above article addresses the carbon emissions/climate change aspect of environmental impacts, but leaves out the potential hazard of oil spills over the continental US's largest underground water source, the Ogallala Aquifer. While TransCanada promises to build the "safest pipeline ever constructed in the U.S.," burying the pipeline deeper under the ground than most other pipelines, the Ogallala Aquifer varies in depth. Some parts of it are 1,200 feet underground; others are just five feet beneath the surface. TransCanada may in fact build the pipeline directly through the waters of the Ogallala Aquifer.
Safer Than Railroads?
The issue of rail tanker transport keeps coming up in the news, since there have been more & more oil tanker accidents lately. This is mostly due to the fact that oil transport by rail has increased about 900% in the past two years.
That fact puts another question to the forefront: if oil & gas companies are investing so much into increasing oil tanker transport, will they really be planning to transport less oil by train if the pipeline is approved? Business logic says no. It will still be profitable to transport oil by rail even if the pipeline is operating - perhaps especially so, if the pipeline reaches full capacity. More oil to the refineries = more profits.
A bit about safety - The Association of American Railroads claims in this paper that barrel-for-barrel, tanker rail transport has a far smaller chance of spillage than pipelines.
From the bottom of that report:
"Railroads are required to report spills of any size. Pipelines are only required to report spills
of greater than 5 gallons unless the spill also involves a fatality, and injury, or costs greater than
$50,000. "
...I wonder if that includes cumulative "drips" or slow leaks?
Safer or not, the thought that oil companies operating in the Canadian Tar Sands will likely be shipping oil by both pipeline and by train leads to the conclusion that the chance of accidents/spills will have increased significantly if the pipeline is built.
That is a big "IF," considering the problems TransCanada is having regarding eminent domain issues in Nebraska, and the fact that President Obama has not yet put his stamp of approval on the project.